The Super Bowl: Through The Years
Client:
CNN, Atlanta | Website
Services provided:
- Data visualization
- Infographics
- Research
- Visual journalism
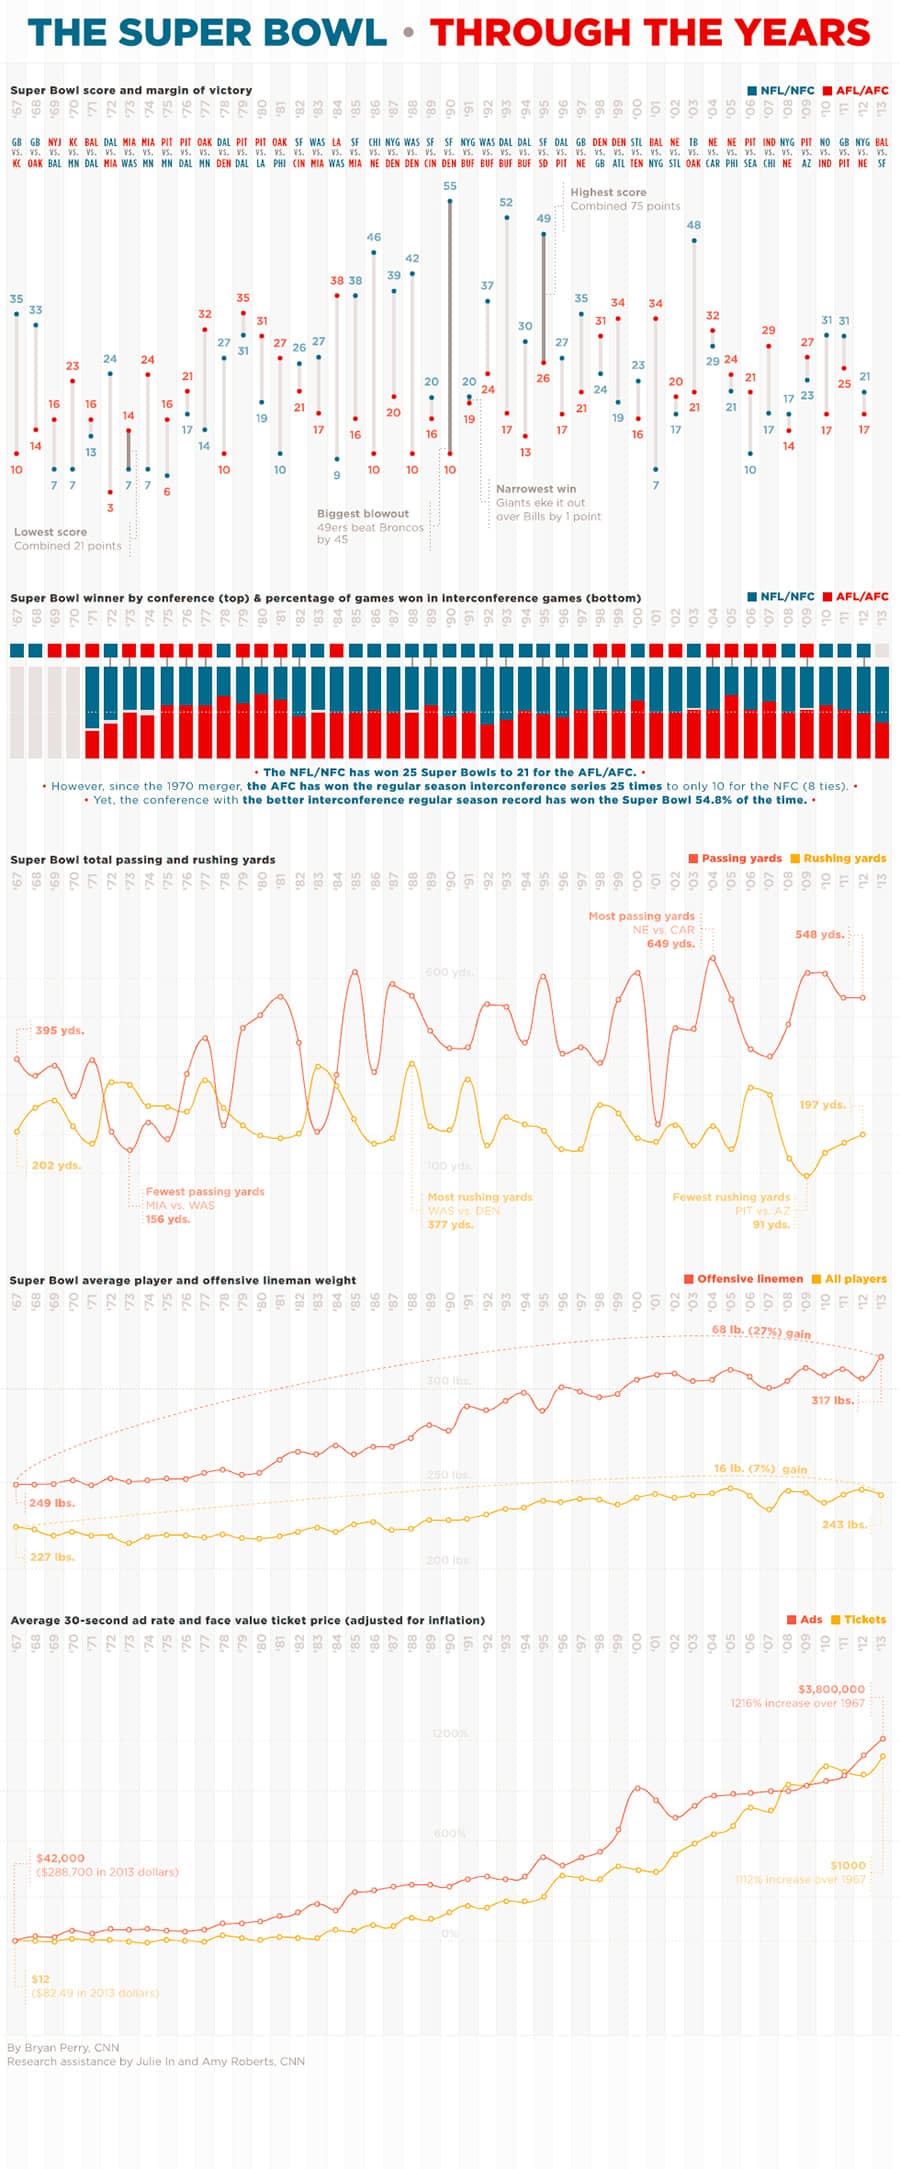
In 2013, I worked with the research journalist of CNN’s library to answer the question: “how has the game of football changed over the years?” Using the upcoming Super Bowl as the occasion, we researched various data sets about football over the years, and from those I designed this graphic which tracks multiple stats over a common, time-based grid: Super Bowl scores; which conference won; passing vs. rushing yards; average weight of players; average cost of ads (adjusted for inflation). The result is a graphic that shows a game that is much changed since its inception in 1967. The infographic can be seen below and on CNN’s site.